- Research
- Open access
- Published:
Life cycle assessment of MycoWorks’ Reishi™: the first low-carbon and biodegradable alternative leather
Environmental Sciences Europe volume 34, Article number: 120 (2022)
Abstract
Background
Over the past few years, several alternative leather technologies have emerged and promise advantages over incumbent leathers with respect to sustainability despite most containing enough plastic to prevent safe and effective biodegradation. Of the alternative leathers in production or advanced development, few fit the dual criteria of low-carbon and near-zero plastic. Reishi™ is a leather alternative, grown using MycoWorks’ Fine Mycelium™ technology, with less than 1% polymer content and satisfies the same performance, quality, and hand feel as animal leather. We present here the first Life Cycle Assessment (LCA) of Reishi™, detailing its “cradle-to-gate” carbon footprint and broader environmental profile. The pilot- and full-scale production of 1 m2 of post-processed, finished, and packaged Reishi™ both before and after production improvement implementations is modeled, and the environmental footprint impact assessment method is performed.
Results
It was found that Reishi’s™ carbon footprint is as low as 2.76 kg CO2-eq per m2, or 8% of the value of the bovine leather benchmark modeled. Furthermore, it was found that Reishi™ has a lower impact compared to bovine leather modeled across a number of impact categories, including eutrophication, ecotoxicity, human health effects, and others. Reishi’s™ impact “hotspots” were determined, with the largest opportunity for further reduction being improved energy efficiency in the growth of mycelium, in particular, the process’s sterilization of raw material inputs via autoclave tools. It is also shown that MycoWorks’ passive process for growing mycelium has a carbon footprint two orders of magnitude lower than incumbent mycelium growth processes that actively consume carbon dioxide gas, which MycoWorks’ process does not require.
Conclusions
Reishi™ is shown to be a promising sustainable material through its unique combination of natural quality, low-carbon footprint as determined by this LCA, and biodegradability due to its lack of plastic or crosslinked content. Its manufacturing process is low impact even when produced at a scale of tens of thousands of square meters per year—a miniscule fraction of the billions of square meters of bovine leather already sold per year. With further use of this leather alternative, additional efficiency gains are likely to be realized.
Background
The fashion and broader consumer goods industries are facing increasing pressure to reduce the environmental footprint of their products: to respond to consumer demand, to comply with evolving environmental regulations, and to meet shareholder- or industry-imposed targets, such as the Science Based Targets initiative [36]. Representative of this is the explosion in demand for both non-animal and non-plastic materials in consumer items, such as fashion goods [14], that has recently led to a proliferation of “alternative leather” technologies made from mycelium, cactus, grape, and various other “bio-based” materials. These alternative leathers are expected to comprise a US$2.2 Billion per annum market as early as 2026 [23]. While many of these alternative leather technologies promise advantages over incumbent leathers with respect to their carbon footprint, many still contain enough plastic to prevent effective biodegradation and therefore may offer little or no overall advantage over either animal or plastic leathers.
Leather’s importance is due to its unique position as both an esthetic and performance material. It is fundamentally an emotional product whose hand feel ("haptics”) and durability have invoked the definition of luxury by humans for thousands of years [38]. Today, “leather” is a blanket term for leather-like materials that can be characterized as either natural or plastic based on the primary constituents in the material. These constituents contribute to the materials’ structural (strength & durability) and haptic (hand feel) properties, the two main measures of a leather’s quality and performance, and there exists a wide range of properties achievable in leathers due to the various raw materials (cowhide, lambskin, polyurethane, etc.) used or a combination thereof. As such, the term “leather” encompasses a wide range of materials made from hides of various types of animals and/or made from plastics, such as polyurethane (PU) and polyvinylchloride (PVC).
Animal leathers are typically associated with a high carbon footprint and various other ecotoxicity, water, human health, and land-use impacts. Bovine leather, for example, is a by-product or co-product of the beef industry, which is a major source of greenhouse gas emissions [42], poses toxicity risks to humans and the environment due to high intensity of chemical use in the hide tanning process [8, 16, 18], and is a major source of water pollution with particular concern of Nitrogen and Chromium in effluent water from treatment and tanning [13, 17].
Conversely, plastic-based leathers, such as “PU leather” (aka “Vegan Leather”), have a lower carbon footprint from production than bovine leather but yield adverse environmental impacts during and at the end of its lifecycle. They are dependent on fossil resources, their polymers take centuries to break down naturally, and their incineration releases toxic chemicals [16, 32, 40]. The branding of plastic leathers such as PU leather as “vegan leathers” is but a “red herring” that distracts from issues ranging from microplastic pollution to landfill and ocean accumulation, issues with such severe negative impacts that the United Nations recently resolved to end plastic pollution [41].
The global fashion holding company Kering estimates that PU leather has ~ 33% less impact than animal leather on a per-square-meter basis [5]; of course, an application requiring a 33% thicker PU leather would therefore nullify such an advantage, illustrating how such incremental improvements may find difficulty translating into macro-scale impact. Although the fashion industry has painted non-biodegradable and/or petroleum-based fabrics and leathers as more sustainable than their naturally derived counterparts, this position is becoming increasingly discredited as more thorough research is performed and more wholistic views are taken [39].
Today, virtually all “vegan leathers” in products available in the market are in fact made from polyurethane (PU) and/or polyvinylchloride (PVC), plastics that comprise a significant percentage of global landfill [11] and fall under a category of cross-linked polymers that cannot be readily recycled and so contribute to the 91% of plastic that is not recycled globally [30]. Plastic textiles, including “vegan leathers,” make up 36% of all global plastic waste [33]. In MacLeod et al.’s “The global threat from plastic pollution” published in Science [21], they state that “Potential impacts from poorly reversible plastic pollution include changes to carbon and nutrient cycles; habitat changes within soils, sediments, and aquatic ecosystems; co-occurring biological impacts on endangered or keystone species; ecotoxicity; and related societal impacts.” Furthermore, it was recently found that microplastic pollution, a by-product of plastic products, has become so ubiquitous that they are now present in Antarctic snow, further indicating that, like carbon emissions, plastics have the ability to negatively impact ecosystems globally even when used and emitted locally [2].
The use of plastic in “vegan leathers” and their lack of biodegradability have become extremely important product attributes in the eyes of both consumers and climate scientists alike [33]. It is apparent that a wholistic solution—one that avoids the carbon emissions and cruelty issues of an animal hide while simultaneously avoiding the use of plastic—would offer opportunities in the consumer economy. As such, to have significant impact, an alternative leather must have a near order-of-magnitude or greater reduction in both carbon footprint and plastic content so as not to compromise on structural and haptic properties.
Of the alternative leathers currently known to be in production or advanced development, few fit the dual criteria of low-carbon and near-zero plastic; all of those that do are mycelium based. Conversely, however, not all mycelium materials coming to market are plastic free. Table 1 lists all the alternative leathers known to be in or near production, their description, and classification. It can be seen from the description of the materials in this table that many alternative leathers marketed as “plant-based” are, in fact, plastic based.
Note that many animal and alternative leathers, including all those listed under Natural Materials, use a very thin “aniline” or “semi-aniline” finish that contains an overall negligible amount of PU as these coatings tend to be less than 10 µm in thickness, i.e., less than ~ 1% of the material by thickness and mass. However, many leathers, including alternative leathers, such as Mylo™, contain a thick polyurethane layer that plays an essential role in the materials’ structural performance and becomes the primary haptic of the material (i.e., governs the hand feel). These thick layers can be in the range of 100–500 µm, or 10–50% of the material by thickness and mass, and are therefore most akin to “Bicast Leather” or “Bonded Leather:” inexpensive, down-market products which use animal hide that is either coated or mixed with Polyurethane, respectively [4].
The natural materials in Table 1 (i.e., those derived from mycelium and without a thick polyurethane layer applied to the surface) are those made by MycoWorks, Mogu, and Ecovative. The carbon intensity of production for each of these has not yet been published. The production techniques differ, where Ecovative’s Forager™ material uses an active growth process while both Mogu and MycoWorks’ Reishi™ use a passive growth process. The active growth process involves pumping large amounts of CO2 into the growth chamber because it is well understood that a high CO2 environment promotes the growth of mycelium and prevents the growth of mushrooms [43]. The carbon footprint for these “mushroom leathers” produced using an active growth process is likely very high due to the combustion of fuels at the CO2 production source, and in turn the release of this CO2 into the atmosphere during their mycelium growth process [3]. This is in contrast to MycoWorks’ and Mogu’s passive growth process that consumes no gases.
Based on publicly available information regarding the Ecovative process that is used to produce both their Forager™ material and the mycelium for Bolt Threads’ Mylo™ material [43], the consumption of CO2 is so high as to potentially exceed that of animal leathers by an order of magnitude (a calculation for this is presented in the SI). As such, it appears that only two possible candidates currently exist for both a low-carbon and biodegradable material with a natural haptic: mycelium materials from both MycoWorks Inc. and Mogu. While the carbon footprint of Mogu has not yet been published, the carbon footprint for MycoWorks’ Reishi™ is detailed herein.
Reishi™, a relatively new biomaterial produced solely by and proprietary to MycoWorks Inc. (California, USA), is an alternative leather that has both a substantial reduction in carbon footprint while using no plastic as a structural base or haptic, in addition to having other environmental benefits, as we will demonstrate in this paper. Reishi™ compares in quality, hand feel, and performance to animal leathers [26] and has been adopted by leading global luxury brands, demonstrating its capability to have impact. Reishi™ is created with Fine Mycelium™, a biotechnology platform invented by MycoWorks to engineer mycelium (the thin fibrous network which makes up the fungal organism) into custom-grown, made-to-order materials. Fine Mycelium™ also refers to the material created via this proprietary process, which undergoes dyeing, lubricating, and finishing processes to be made into Reishi™, a leather-like product [28].
While the structural composition of Reishi™ as non-crosslinked, pure biomass material means it is biodegradable in nature, whether it meets the low-carbon criteria was not yet published. A Life Cycle Assessment (LCA) has been performed on Reishi™, outlined below, to determine whether it meets this dual criteria essential for low-impact alternative leathers. Biodegradable fungi-based materials do not rely on livestock farming, and require minimal fossil resources and natural land, thereby suggesting a material with a favorable environmental performance is possible if no substantial CO2 is required during the growth of such fungi [12, 16, 34]. As outlined herein, active-gas mycelium growth processes require additional fuels to meet high CO2 input requirements, whereas MycoWorks’ passive mycelium growth process results in a drastic reduction in total emissions. Through this analysis, these ostensible advantages of Reishi™ have been thoroughly challenged, and the detailed manufacturing process for the material has been scrutinized for its environmental impact.
The primary aim of this research is to assess the environmental footprint of Reishi™ as a material and compare how it performs in different production-scale scenarios.
Methods
In this study, a Life Cycle Assessment (LCA) following the ISO14040/14044 standard is used to quantify the environmental footprint of Reishi™. Life Cycle Assessment is a standardized methodology which compiles the inputs and outputs of a product system and evaluates its potential environmental impact [15]. Life Cycle Assessment can be used to quantify the impact of a product on a number of impact categories, such as water scarcity, ecotoxicity, land use, eutrophication, and climate change. Climate change is considered one of the most pressing environmental issues of our time and is also a good predictor for several other environmental impacts [1]. Accordingly, quantifying the carbon footprint of a product (i.e. the impact on climate change) is seen as an entry point for assessing environmental performance [45]. Additional impact categories are also presented.
It should be noted that current LCAs do not account for potential risks and impacts from emissions of micro- and nano-plastics in the environment [22]. Therefore, further contemplation of other factors, such as biodegradability as presented in the introduction above, helps present a comprehensive environmental performance of Reishi™. The following sections detail the product system evaluated and the technical specifications of the study.
Product under study
Reishi™ is a custom-made biomaterial that compares in quality, performance, and hand feel to high-quality animal leathers [27]. Fine Mycelium™ is the underlying technology in Reishi™ and engineers mycelium cells into three dimensional structures that are densely entwined to result in enhanced strength, durability, and haptics compared to naturally occurring mycelium or “mushroom leather” (see Figs. 1, 2).

Visual representation of the cross section of Fine Mycelium without (left) and with (right) an embedded fabric material

Simplified visual representation of the Reishi™ production process
MycoWorks produces Reishi™ tailored with an in situ embedded fabric material or with no fabric at all. There is a range of fabric materials which can be chosen to be embedded within Reishi™. The fabric material (also known as the “structural base addition”) is placed in the tray, and the mycelium grows to fill into the fabric and then above it, thereby embedding it within the mycelium (as shown in Fig. 1).
As an additional option, the mycelium can grow to an adequate strength and robustness with no added textile as the structural base addition. For the sake of this research, three material variations were modeled (where the material input is the only variable changing and all other processes are held constant):
-
1)
mycelium with cotton (100% cotton material embedded in mycelium)
-
2)
mycelium with recycled polyester (100% recycled non-woven polyester embedded in mycelium)
-
3)
mycelium only (no fabric material embedded within the mycelium as a structural base, using solely mycelium).
Note that for each of these model variations, the only aspect which varies is the material for the embedded fabric material, with all other inputs and outputs remaining the same.
The Fine Mycelium™ process uses a natural feedstock, including waste sawdust as its food source, requires minimal water, and is grown with little-to-no light exposure in a facility climate controlled to room temperature.
Functional unit and reference flow
The functional unit describes the unit of analysis which the inputs and outputs are collected in reference to in a qualitative and quantitative way. The functional unit of this study is 1 m2 of Reishi™, i.e., post-processed*, finished, and packaged leather-like** material with natural haptics, satisfying similar performance, quality, and hand feel as animal leather.
*In the case of Reishi™, this means dyed and lubricated.
**Refer to the Background section, where leather is defined as “a blanket term for leather-like materials that can be characterized as either natural or plastic based on the primary constituents in the material.”
The reference flow is the amount of product required to fulfill the functional unit accounting for product or material losses throughout the value chain, denoting that more than 1 m2 of Reishi™ is required to fulfill the 1 m2 being available for sale.
System boundaries
In LCA, the system boundaries indicate which stages and activities of a product’s lifecycle are included in the assessment. Reishi™ is considered an intermediate product with a large range of potential final uses. Consequently, the product system analyzed is cradle-to-gate, meaning it includes the processes from raw materials production and pre-processing through Reishi™ leaving a tannery facility (Fig. 3). The main processes involved are the production of raw materials for sheet production, growth of the Reishi™ sheet, transport from the production factory to the tannery, post-processing and finishing, and packaging of the final product.
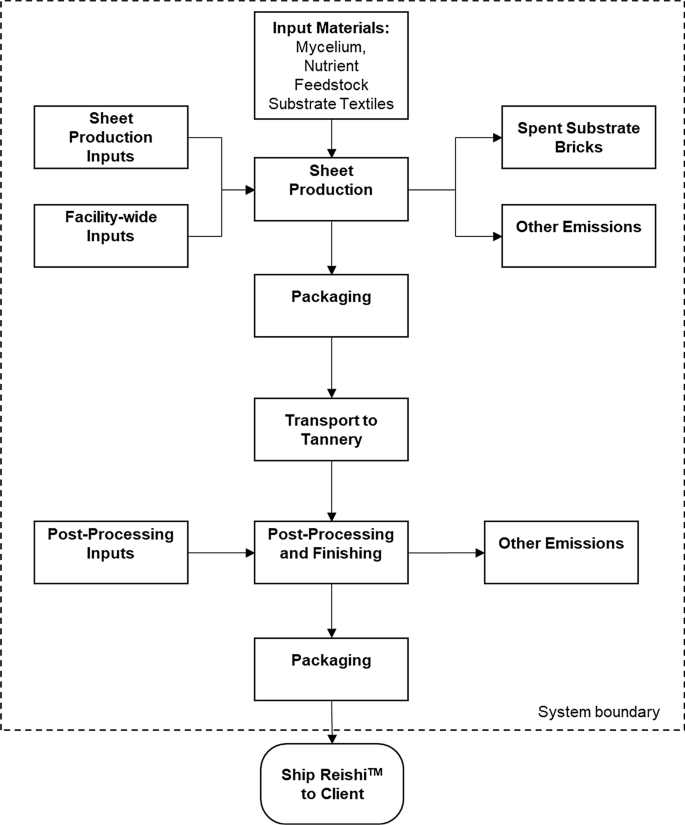
Schematic overview of Reishi™ production
Data collection
We collected primary foreground data on the material requirements for production and post-processing, transport distances of procured materials, energy and water usage for the production and tannery sites, waste disposal for the production and tannery sites, the site-specific electricity mix and heat source for the production facility, transport distance between production and tannery site, and packaging materials. Variations of these data are used in different scenarios as detailed below.
Ecoinvent 3.6 (allocation, cut-off by classification) was used as the main background database [35], with use of processes from Agri-footprint 4.0 (economic allocation) [9] when necessary. These two databases are considered to be compatible for use in combination; both databases use economic allocation (which is consistent with the allocation procedure used in the foreground system), and while some Agri-footprint processes use other data in the background (e.g., ELCD for electricity and transport), this was not the case for the processes used.
These databases include data on emissions, raw material inputs, technology, energy inputs, water, and transport for materials and processes. In instances where an appropriate secondary dataset was not available, proxies were used. Refer to Additional file 1 for supplementary details on the datasets used and Additional file 2 for the LCI file of the foreground system.
Capital goods were excluded from this analysis. Aligned with the PEF methodology which states that “Capital goods (including infrastructure) and their EoL [end of life] should be excluded, unless there is evidence from previous studies that they are relevant,” evidence for relevance was sought and not found. While this product system is within an emerging industry, there is no obvious argument for including capital goods in the analysis. Further, the leather Product Environmental Footprint Category Rules (PEFCR) does not identify capital goods as mandatory company-specific data [6], implying that capital goods are not among the most relevant processes.
Additional processes are also justified to be excluded from the system modeled. Production of packaging materials for procured raw materials were excluded due to their assumed negligible contribution to the product carbon footprint. Tertiary packaging was also excluded, given the very large quantities (thousands) of Reishi™ sheets that can be shipped on a single palette. Energy use for office space and quality control was excluded to isolate the inputs associated solely with the production of Reishi™.
Modeling choices
Life Cycle Assessment modeling was conducted using SimaPro 9.0. In instances where multi-functional processes occur (i.e., processes or facilities providing more than one function), all inputs and emissions associated with the process were partitioned between the multiple goods and/or services. The only multi-functional process in the foreground system is the production process which produces the Reishi™ sheet and spent substrate “brick.” As neither subdivision nor a system expansion was possible, economic allocation was used to divide the environmental impacts between the two outputs as successively justified. Consequently, the allocation procedure in the foreground system (economic) is consistent with the allocation procedure in the background datasets (economic).
For every sheet of Reishi™ produced, the sheet is accompanied by a by-product “brick” of loosely bound substrate (sawdust) and mycelium, which is a biodegradable substance that has been used in agriculture as a soil amendment, among others. When the substrate brick is sold externally it has an economic value and is therefore considered a co-product. If mass allocation were used, a disproportionately high fraction would be attributed to the brick given its large mass and relatively low value. Consequently, economic allocation was chosen to allocate the environmental impact of production up until the point of sale of the brick between the two co-products. By choosing economic allocation, more of the impact is therefore assigned to the Reishi™ sheet versus its co-product brick. To split the facility-wide usage between the processes occurring before and after the substrate brick is sold the time required for each production process was used.
For end-of-life allocation, the cut-off approach was used in the background and foreground data. This means that in instances where recycled material is used throughout the value chain the recycled materials come burden free, accounting for only the resources and emissions associated with the recycling process, including transportation.
End-of-life allocation is particularly relevant for the footprint of the version of Reishi™ produced with recycled polyester. In practice, the recycled polyester could be sourced from systems which consider it either as a recyclable material, as having economic value, or alternatively as a waste product. As a result, each system would require different modeling. The recycled polyester in this product system modeled is considered a recyclable material and is modeled accordingly with the cut-off approach. This means that the fabric impact includes only the processes associated with recycling virgin material into secondary material and not the production impacts of the virgin material.
For facility-wide energy usage, the impacts were allocated to the sheet and brick based on the operational capacity of the facility (e.g., when the operational capacity is at x sheets per day, this daily usage is divided between x sheets and substrate bricks).
Scenario modeling
Reishi™ is currently being produced at pilot scale in California and will soon be produced at full scale at a production facility currently under construction in August 2022. Given Reishi™ is a material still in its relative infancy, there are still several opportunities for reducing the product's environmental footprint. The Life Cycle Impact Assessment (LCIA) results from the initial LCA revealed some improvement opportunities that MycoWorks subsequently implemented in the pilot-scale facility and have designed into the full-scale facility.
To make a fair assessment on the imminent environmental footprint of the material, scenarios for before and after improvement implementation are modeled for both the pilot-scale and upcoming full-scale operations. This section summarizes the details of these four scenarios modeled. The details of production are as per the “product under study” section above, with the following scenarios each being adaptations of this product system. Table 2 shows an overview of the main differences between the scenarios. For further detail on how the scenarios differ, please refer to the Additional files.
Scenario 1: Pilot-scale day one
The “pilot-scale day one" scenario represents the production of Reishi™ using California facility operations at first production, i.e., upon opening of the first-ever Fine Mycelium™ plant. Primary data on the bill of materials (BOM) and manufacturing details are based on the actual operations in November 2021. This included a nutritional grain feedstock, post-processing (including tanning, lubrication, and dyes) and finishing chemistry of the state-of-the-art at the time, the autoclaving tool in sheet production powered with electricity, the natural gas source for Heating, Ventilation, and Air-conditioning (“HVAC”), and electricity powered by 100% wind energy. Energy data were collected from a 12-month period and daily averages were calculated. When produced at the pilot-scale, Reishi™ sheets are produced on-site in California and are then shipped to Spain for post-processing.
Scenario 2: Pilot-scale current
The “pilot-scale current” scenario represents pilot-scale production using current (2022) operations in California that includes improvements that were implemented after the plant was opened. The following improvements were made to the pilot-scale day one scenario: energy for the facility HVAC is now using a more efficient generation technology, there is lower sale price for Reishi™, the brick is sold as a co-product, there has been a replacement of tanning chemistry with less impactful lubrication fatliquors, and there is now a reuse of some of growth tray components. As traditional tanning was eliminated for the production of Reishi™, it was determined that 10% of the total tannery energy use, water consumption, and waste production are required for the remaining finishing process. In addition, sheet growth was improved to allow for a slightly larger harvested area and concomitantly higher mass using the same inputs.
Scenario 3: Full-scale day one
The “full-scale day one” scenario represents the day one production anticipated at the full-scale facility in South Carolina, expected to be operational in 2023. Some of the main differences to the current pilot-scale production are on-site post-processing (eliminating the need to ship to tanneries), a higher production capacity per square meter of facility, a lower sale price for Reishi™, a different electricity mix (2/3 solar and 1/3 hydropower compared to 100% wind power), factory-wide energy use for HVAC derived from biogas (instead of natural gas), and autoclaving for sheet production derived from biogas (instead of electricity).
To estimate the energy usage for full-scale production the expected utilization of total electricity and gas capacity was calculated based on the planned running time of 24 h per day on two labor shifts. The split between consumption for sheet production process and factory-wide energy (for HVAC and lighting) was estimated using engineering designs for the full-scale plant. The annual production capacity was estimated using expert judgement assuming 365 production days per year.
Scenario 4: Full-scale with planned improvements
The fourth and final “full-scale with planned improvements” scenario represents the expected full-scale operations with planned improvements implemented, all of which are claimed by MycoWorks to be technically demonstrated and in-process for scaled implementation. In this scenario, the following changes were made to the full-scale day one scenario: a lower Reishi™ sheet price, reuse of some of the growth tray components, energy for autoclaving derived from electricity instead of natural gas, a recycled corn-based nutrient source for the feedstock, and the brick substrate reused once.
Impact assessment method
The Environmental Footprint (EF) impact assessment method documented in the European Commission’s Product Environmental Footprint (PEF) method was used, namely, version 3.0 [46]. The EF method was selected as it is recommended by the European Commission and can be considered a general European consensus. Additionally, a majority of the luxury fashion and broader consumer goods industry (for whom this paper is largely relevant for) is based in Europe, further supporting this choice.
The characterized results, the normalized and weighted results, and the “single score” (i.e., the summed normalized and weighted results) are assessed in the interpretation. The characterized results are the impacts for each impact category expressed at the midpoint level (e.g., the carbon footprint expressed in kg CO2 eq. per m2). Normalization and weighting enable the results for each impact category to be expressed in the same unit, μPt per m2. This is calculated by applying the normalization factor (representing, e.g., the average impact per person per year) to the characterized results, and then applying the weighting factor (representing the perceived relevance and importance of each category) to the normalized results. These normalized and weighted results are subsequently summed into the “single score,” which in this paper is referred to as the “total environmental footprint.”
Note that weighting applies a value judgement, and therefore some subjectivity to the results. Consequently, caution should be taken when interpreting the normalized and weighted results, and the total environmental footprint. In this research, calculating the weighted and normalized results was deemed as useful to provide a basis for future research into impact categories potentially most relevant for Reishi™.
Firstly, the carbon footprint as well as process hotspots for Reishi™ at pilot-scale and full-scale was assessed. Then, the characterized results of a wider range of impact categories were evaluated to identify any trade-offs associated with scaling-up production. Finally, the normalized and weighted results were assessed to identify the impact categories contributing most to the total environmental footprint.
Results
For each scenario the overall carbon footprint results are presented for Reishi™ produced with the three fabric options included in this study: mycelium with cotton, mycelium with recycled polyester, and mycelium only. This is followed by the main findings from the contribution analysis for Reishi™ produced with mycelium only, which shows the relative contribution of different stages of the production and post-processing to the total product carbon footprint. To aid the interpretation of results the processes in the product system were grouped together (see Table 3).
Note that it has already been established that Reishi™ qualifies for the qualitative aspects of the functional unit (material with natural haptics and satisfying the same performance, quality, and hand feel as animal leather), as justified in the background section of this paper.
Scenario 1: Pilot-scale day one
The carbon footprint of 1 m2 of post-processed, finished, and packaged Reishi™ produced in the relatively primitive and extremely low production volume (i.e., thousands of square feet per year, or many orders of magnitude smaller than global leather production) “pilot-scale day one” operations is 17.65 kg CO2 eq. using cotton as the fabric material choice, 14.9 kg CO2 eq. using recycled polyester, and 14.5 kg CO2 eq. using mycelium only.
The contribution analysis in Fig. 4 illustrates that, for Reishi™ using mycelium only, facility energy usage (primarily for HVAC) has the greatest contribution (57%), where heat from natural (See Table 4) gas is the main driver (49%) followed by electricity use (8%). This can be explained by the facility having a higher HVAC use than a typical warehouse due to the facility’s relatively narrow required range that the temperature cannot deviate from. This is critical to the process and must be maintained throughout the entirety of production.

Carbon footprint contribution analysis for 1m2 of finished Reishi™
Production of raw materials for sheet production is the next largest contributor (15%), of which the grain-based nutrient feedstock is the largest contributor (9%) followed by some of the growth tray components (5%). The post-processing step has an only somewhat significant impact, with the chemicals and tannery operations contributing 10% and 6%, respectively. Impact from energy use for sheet production is somewhat minimal (7%) and is driven by the electricity use. The remaining groups have a relatively small impact, refer to Table 4 for further details.
Scenario 2: Pilot-scale current
The carbon footprint of 1 m2 of post-processed, finished, and packaged Reishi™ produced in the still miniscule “pilot-scale current” operations is 9.34 kg CO2 eq. using cotton as the fabric material choice, 6.59 kg CO2 eq. using recycled polyester, and 6.20 kg CO2 eq. using mycelium only. Taking mycelium only as the fabric choice, this shows a 57% reduction compared to the day one operations that resulted from rapid efficiencies that were implemented after the pilot-scale plant began production.
Figure 4 shows the relative contribution of different stages of the sheet production and post-processing to this total footprint. A considerable difference compared to the day one scenario is the lower impact from facility energy use due to sourcing natural gas from a more efficient source (see Additional file 1 for more information). In this scenario, there is no longer a tanning step as it has been replaced by a simpler dyeing and lubrication step, which results in the impact from tanning chemicals being nearly entirely eliminated; impact is then only due to the finish. Removing the tanning step also considerably reduces the impacts of the tannery operations. The impact of growth tray impacts is noticeably lower which displays the benefit of its reuse.
Further reductions shown in the numerical footprint of Reishi™ for processes occurring prior to the point of sale of the substrate brick are due to the economic allocation between the Reishi™ sheet and brick. In this scenario, the substrate brick is sold (i.e., has an economic value) for ~ 1.1% of the value of a sheet of Reishi™, and the economic allocation is used to divide the environmental impact of all processes up until the point of sale for the substrate brick (raw materials for sheet production, energy for sheet production, and a part of facility electricity use, facility energy use, and production waste). This can be seen, for instance, in the lower impact of electricity for sheet production, where the electricity amount and source remain the same; however, impact allocated to the sheet is reduced. For more detail on the relative contribution of different processes for this scenario, refer to Table 4.
Scenario 3: Full-scale day one
The expected carbon footprint of 1 m2 of post-processed, finished, and packaged Reishi™ produced in the relatively primitive “full-scale day one” operations is 16.92 kg CO2 eq. using cotton as the fabric material choice, 14.18 kg CO2 eq. using recycled polyester, and 13.88 kg CO2 eq. using mycelium only.
While the absolute carbon footprint is similar to that in the “pilot-scale day one” scenario (a 4.3% decrease using mycelium only), there are some differences in the hotspots. Figure 4 shows the greatest contributor is the energy usage for sheet production (60%) which is split almost equally between electricity and heat from biogas. This is considerably higher than in the pilot scale for two reasons; the autoclave tool uses heat from biogas instead of electricity (where energy from biogas has a higher impact per megajoule than the wind electricity used in the pilot scale) and the per-sheet energy consumption for production is higher (as shown in Table 2).
The next highest contributor is the facility-wide energy usage (21%), where most comes from electricity (18%) and the remainder from heat from biogas (3%). Compared to the current pilot-scale scenario, the impact from electricity use is 172% higher; however, the impact from heat usage is 77% lower. The full-scale operations have a greater production capacity, meaning that facility-wide energy demands are shared between a larger number of products. Although the per-sheet consumption is lower than in the pilot scale, the greater impact from electricity is driven by slightly higher impact electricity mix (1/3 hydro and 2/3 solar compared to 100% wind). The drastic reduction in impact from facility-wide HVAC is due to the energy source being a biogas from the local utility’s methane-recapture operations compared to natural gas, in combination with lower per-sheet energy demands. Raw materials for sheet production also have a significant contribution (15%), where the majority of its impact is coming from the nutrient feedstock (9%) followed by the growth tray components (5%). Refer to Table 4 for more detail on the hotspots.
Further reduction in the overall numerical footprint of Reishi™ is the lower price at which the sheets are sold. With larger-scale operations enabling sheets to be sold at a lower price, the economic allocation of the sheet is lower. Consequently, further overall reductions are seen in the processes occurring prior to the point of sale of the substrate brick due to the reduced sheet sale price altering the economic allocation, thus attributing a smaller portion of impact to the Reishi™ as previously explained.
Similar to the current pilot-scale scenario, the post-processing chemicals and operations have a minimal impact (0.02% and 0.87% respectively). The post-processing chemicals used remain the same as in the current pilot scale; however, further reduction in post-processing impact is due to the renewable electricity mix at the US tannery site (i.e., the same factory) having a lower impact than the Spanish grid mix (which is where the partner tannery for the pilot scale is located). Additionally, because the tannery is effectively on-site, the shipping impacts are eliminated.
Scenario 4: Full-scale with planned improvements
The expected carbon footprint utilizing planned improvements to the full-scale operations, i.e., the plant’s designed operational point, for 1 m2 of finished and packaged Reishi™ is 5.80 kg CO2 eq. using cotton as the fabric material choice, 3.06 kg CO2 eq. using recycled polyester, and 2.76 kg CO2 eq. using mycelium only. This shows an expected 80% reduction compared to the full-scale day one footprint. This is expected to be the steady-state carbon footprint emissions for the plant starting within a few months of its commissioning but does not represent the ultimate minimum value achievable.
Figure 4 shows the relative contribution from different stages of production and post-processing to the footprint using mycelium only production. The greatest contributor in this scenario is the energy use for mycelium sheet production (41%); however, in absolute value this is significantly lower than in the full-scale day one scenario. While the per-sheet energy consumption for sheet production remains the same, the large reduction is realized by switching the autoclaving energy source from heat from biogas to electricity (which has a lower impact per energy unit consumed). Facility-wide energy use is the next largest contributor (32%), although the absolute impact is also far lower than in the full-scale day one scenario. The reduction in electricity is largely driven by switching to a more efficient renewable electricity source (100% wind compared to 1/3 hydro and 2/3 solar) per the local utility. Like in scenarios above, further numerical reductions (for instance, in the facility-wide energy usage) are seen from the reduced sale price of Reishi™.
Notably, the raw materials for mycelium sheet production have a much lower impact than in all previous scenarios. This is largely a consequence of changing the nutritional grain feedstock to a recycled corn-based nutrient feedstock and also due to the reuse of the brick substrate, meaning less raw materials are required per sheet grown. For more detail on the relative contribution of different processes for this scenario, refer to Table 4.
Implications of included fabric material choice on the carbon footprint
MycoWorks produces Reishi™ tailored to include, or not include, an embedded fabric material specified by the customer. The impacts of different fabrics vary greatly; for example, virgin cotton, virgin polyester, and recycled polyester have a carbon footprint of 11.29, 5.59, and 1.11 kgCO2 eq./kg of textile, respectively [25], indicating that the fabric choice plays a major role in the resulting total carbon footprint of Reishi™.
The contribution analysis in the previous section was shown for Reishi™ made from mycelium only.
Table 5 displays the carbon footprint of Reishi™ using different fabric material choices. Figure 5 illustrates how heavily the carbon footprint of Reishi™ is influenced by the impact of the fabric material chosen, and how this compares to a benchmark bovine leather we modeled (see Additional file 1 for details).

Carbon footprint of 1m2 of traditional bovine leather modeled compared to 1m2 of finished Reishi™ (produced in full-scale with planned improvements scenario using different embedded fabrics)
Environmental footprint: all scenarios
As outlined in the introduction, environmental impacts beyond carbon footprint should also be considered to establish a wholistic view of the material’s sustainability profile (Laurent et al. 2012). Accordingly, this section provides preliminary insights into the potential impact of Reishi™ on other environmental impact categories to identify any environmental trade-offs of scaling-up production.
Figure 6 shows that when looking at the characterized results for all impact categories there is a clear general trend that implementation of improvements at each individual scale greatly reduces the environmental footprint of Reishi™ with no obvious trade-offs present. As expected, the full-scale day one impact is larger than the current pilot-scale impact. This demonstrates the importance of improvement implementation when scaling-up production to realize the most optimal environmental footprint.

Characterized midpoint LCIA results, where the highest score is scaled to 100%
Figure 7 shows the normalized and weighted results for each impact category and their contribution to the total environmental footprint. This illustrates that for each of the scenarios the impact categories contributing to most of the environmental footprint are resource use (minerals and metals), climate change, cancer human health effects, and resource use (energy carriers).

Contribution of each impact category to the total environmental footprint for each scenario. Calculated using the normalized and weighted results for each impact category
Discussion
These results have shown that Reishi™ holds promise as a low-impact leather-like material with natural haptics. This study has calculated the carbon footprint of Reishi™ when produced under pilot-scale operations (day one and current scenarios) and prospectively calculated the footprint for full-scale operations (day one and with planned improvements scenarios) for a plant that has already been fully designed and engineered based on the existing pilot plant. The contribution analyses identified which parts of the cradle-to-gate product value chain contribute most to the carbon footprint for each of these scenarios. Finally, the impact categories which appear to be most relevant for Reishi™ were identified. In this section we will discuss (1) production opportunities, (2) limitations of this study, and (3) practical implications for the sector.
Production opportunities
The day one results revealed several process “hotspots” in the production of Reishi™ (see Fig. 4). These hotspots provide focus for where to target future impact reduction efforts. The most effective reduction opportunities identified (some of which have already been implemented) include the following: sourcing lower-impact biogas for HVAC (such as sequestered methane sourced from landfill or biogas from anaerobic digestion by the local utility supplying the full-scale plant in South Carolina), reduction in—or elimination of—chemical use in post-processing, use of electricity rather than gas for autoclaving, and sourcing 100% wind electricity. Alongside general improvements in energy efficiency of the process, such as changing sterilization from autoclaving to another suitable process, the scaling-up of Reishi™ production will significantly reduce the carbon footprint with economies of scale allowing factory resources, in particular, HVAC, to be split between larger volumes of Reishi™ sheets. It is important to note that although reducing the sale price of the sheet will also largely reduce the numerical footprint of Reishi™, this does not decrease the true environmental footprint of operations.
The two scenarios with improvements show the significant opportunity that technical development has on the impact footprint. The “pilot-scale current” scenario demonstrates that a 57% reduction in carbon footprint has already been realized after implementation of technical changes. Similarly, the “full-scale with planned improvements” scenario shows the potential carbon footprint savings (80% reduction) expected once improvements are implemented at this site. This illustrates the relative infancy of mycelium as an industrialized process relative to the maturity of animal leathers; it is conceivable that further significant improvements for mycelium’s environmental footprint are possible by extrapolating the efficiencies that other industries have seen in both energy usage and economies of scale over their decades of scale-up relative to Fine Mycelium’s™ mere months devoted to scale-up thus far.
Limitations
The pilot-scale models (“day one” and “current”) are robust; however, some improvements could be made to increase certainty in the results. While primary data were used for processes under direct or operational control of MycoWorks, secondary data sources were relied on for upstream processes. When accurate background datasets were not available, proxies were taken (e.g., for the fatliquor which replaced the tanning chemicals). Further, when country-specific datasets were not available, global datasets were used. To further refine the results, primary data from suppliers could be sourced, such as from the nutrient feedstock, the gas used for HVAC, and the fabrics. Overall, the conclusions drawn from this study are not expected to be heavily influenced by these limitations.
More caution should be applied when analyzing results from the full-scale scenarios. While the pilot-scale models are based upon an actively operational product system, the “full-scale day one” and “full-scale with planned improvements” scenarios are partially prospective. The data points with the highest uncertainties are the energy consumption for mycelium sheet production and facility-wide energy usage, both of which have been estimated by MycoWorks engineers since actual consumed data are not yet available. This uncertainty is relatively low since the energy-consuming systems have already been selected and will be operating at their specified conditions. Consequently, the results from these scenarios should not be taken as concrete but rather serve to provide an estimation for the future footprint of Reishi™. The full-scale day one scenario serves to estimate the short-term (i.e., 2023) footprint, while the scenario with planned improvements looks further into the future. Once the full-scale facility is operational primary data should be collected to update the results to enable more concrete conclusions to be drawn for the full-scale operation.
Material maintenance requirements and longevity are integral to assessing the full lifecycle impacts of a textile. Consequently, to gain a more wholistic picture of the total lifecycle impact of the product—and to effectively compare this material to other alternatives for particular use cases—the scope could be expanded to a cradle-to-grave study for particular use cases in future assessments. As such, an element of time would be introduced into the functional unit that currently only addresses the processed level and quantity.
Practical implications for the fashion and broader consumer goods industries
Studies have begun to hypothesize the environmental impact of fungi-based leather-like materials [16, 19]; however, the research presented in this paper is the first to use LCA to quantify the environmental impact of Reishi™ using primary production data. While the comparison to a specific natural material was out of scope of this research, to place the environmental footprint of Reishi™ in the context of other natural materials (i.e., natural haptics) in the market, we modeled a benchmark bovine leather (see Additional file 1 for details).
Comparison to the benchmark bovine leather modeled suggests Reishi™ has a significantly lower carbon footprint than traditional bovine leather. The carbon footprint of the benchmark leather product modeled is 32.97 kg CO2 eq. per m2, which is significantly higher than the carbon footprint of Reishi™, which (with mycelium only) is currently 6.20 kg CO2 eq. per m2 (an 81% reduction) produced at the pilot scale and is likely to be reduced below 2.76 kg CO2 eq. per m2 (a 92% reduction) with upscaling production and further improvements. These reductions compared to traditional leather are within a similar range to those claimed by plastic haptic leather alternative products, although it is impossible to make any direct reduction comparisons due to a myriad of methodological differences. Modern Meadow estimates a 79% reduction for Bioleather1, Natural Fiber Welding estimates a 93% reduction for Mirium (although the benchmark is a literature source rather than a modeled benchmark), Adriano di Marti estimates a 94% reduction for Desserto (although limited methodological details are available in their early LCA), and a 94% reduction is estimated for Vegea (accounting for the full product life cycle, rather than just “cradle-to-gate”); see Additional file 1 for a summary table of, and sources for, these figures.
Comparing the total environmental footprint of Reishi™ to benchmark bovine leather (i.e., after normalization and weighting of the midpoint results for all impact categories) suggests the lower carbon footprint of Reishi™ comes without environmental trade-offs. The total environmental footprint of the benchmark leather infers that the impact from “cancer human health effects” is the largest in comparison to the other impact categories. While the “resource use” impact categories appeared as most relevant for Reishi™, when looking at absolute impact, the resource use impact of Reishi™ is lower than the benchmark leather used. This thereby indicates that there is no obvious burden shifting if Reishi™ was to be chosen as an alternative to the benchmark leather. When comparing the total environmental footprint, the impact of Reishi™ is considerably lower (an 80–93% reduction for the four scenarios using mycelium only), indicating a promising overall environmental performance. Note that if the cutting efficiency of the benchmark product were accounted for then the footprint of the benchmark would be higher. It is important to note that these findings are specific to this case study and that the conclusions drawn should not be extrapolated to all bovine leather. Further, as explained in the methods section, interpretation of normalized and weighted results should be treated with caution due to the subjectivity in the weighting factors used.
These results are supported by existing literature [12, 16] which indicate that Reishi™ is a leather-like material with a lower carbon footprint than traditional bovine leather. However, to make conclusive statements on overall comparative conclusions and environmental trade-offs between two materials, the scope of this study would need to be expanded to include a more in-depth analysis of the alternative material.
While most of this study focused mainly on identifying the process hotspots of the impact on climate change, further research could investigate the main drivers of impact to other relevant impact categories: in particular, resource use (minerals and metals) and cancer human health effects and resource use (energy carriers), as these are most relevant environmental impact categories for Reishi™.
This research places Reishi™ in the context of natural leather-like materials. Thus, contextualizing Reishi™ within plastic and plastic-like materials (i.e., materials such as PU and rubber that both have plastic haptics) is out of scope of this study. We believe that current LCIA methods (specifically the factors for plastic impacts) are not yet mature enough to make a proper comparison between a natural and a plastic product. Until impacts, such as microplastic pollution, are accounted for, we believe a quantitative assessment of plastic alternatives would not holistically reflect the true impact of the material. Once LCIA methods can more effectively support this comparison, future research could expand the scope to contextualize the environmental footprint of Reishi™ to plastic leather-like materials.
Conclusions
Mycelium, in particular MycoWorks’ Fine Mycelium™, is a technology that has been in development for several years and has been undergoing industrialization and scale-up for months only. There have only been several thousand square meters ever produced, enough to provide an accurate analysis of its impact, but not enough to allow for drastic efficiencies to be unlocked. Despite this, its impact is already low relative to its scale and projected to be far lower with the modest increases in production volumes. This study has shown this material’s beneficial sustainability profile when produced at merely several hundred thousand square meters per year, including a carbon footprint of 2.76 kg CO2 eq/m2 (a 94% reduction compared to bovine leather), much lower impact on eutrophication, ecotoxicity, and human health (see Additional file 1). Note that billions of square meters of animal leathers are currently produced per year in an industry that has existed—and in turn participated in enormous efficiency gains—for many decades.
As argued above, a high-quality alternative leather suited for wide segments of the market will ideally have an order-of-magnitude reduction in carbon footprint while also not wielding a plastic hand feel and using only minimal plastic content in its thin surface coating. While the near-zero (less than 1%) plastic content of Reishi™ was already known, this paper shows the extent to which the low-carbon footprint of Reishi™ makes it an ideal alternative. As a result, Reishi™ is one of the few leather-like materials validated to have a low-carbon footprint and also a natural, biodegradable composition.
The carbon footprint of 1 m2 of post-processed, finished, and packaged Reishi™ in the “pilot-scale day one” scenario was 17.65 kg CO2 eq. using cotton as the fabric material choice, 14.9 kg CO2 eq. using recycled polyester, and 14.5 kg CO2 eq. using mycelium only. Following the implementation of technical changes and process optimization, the footprint was reduced to its current state at pilot scale of 9.34 kg CO2 eq. using cotton as the fabric material choice, 6.59 kg CO2 eq. using recycled polyester, and 6.20 kg CO2 eq. using mycelium only.
At the full-scale facility slated to be operational in 2023, the day one carbon footprint is expected to be approximately 16.92 kg CO2 eq. using cotton as the fabric material choice, 14.18 kg CO2 eq. using recycled polyester, and 13.88 kg CO2 eq. using mycelium only. With the material and process still undergoing optimization, with only demonstrated and planned improvements the carbon footprint is expected to be reduced considerably to 5.80 kg CO2 eq. using cotton as the fabric material choice, 3.06 kg CO2 eq. using recycled polyester, and 2.76 kg CO2 eq. using mycelium only. The characteristics of this scenario with planned improvements are technically feasible, meaning that the realization of these footprints is dependent on implementation. This research should be refreshed periodically to maintain a true picture of the up-to-date product carbon footprint of Reishi™.
The embedded textile of choice has a large influence on the footprint of Reishi™ produced at any scale and stresses that these results should not be extrapolated to Reishi™ made with materials not covered in this study.
Regardless of the scenario, this study has shown that most of the climate change impact from the growth of mycelium comes from the energy use at the mycelium production facility (see Fig. 4). These results also suggest that MycoWorks’ passive growth process (i.e., free of any input gases) is key to its low-carbon footprint. These insights are already being used by MycoWorks as input to further improve production processes and have been used to make engineering decisions for the full-scale plant in South Carolina.
Given the urgency around taking action to reduce the impact on climate change from industries that use large amounts of carbon-intensive or polluting materials, like animal and plastic leathers, and the evolving climate policies to adhere to, it is increasingly essential for users of these materials to have access to high-quality, sustainable options. This research provides the first basis on which brands can assess the carbon footprint of Reishi™ as a material choice. The large reductions in carbon footprints seen in the scenarios with implemented improvements provide an environmental incentive to continue R&D to further reduce the impact footprint, as passively grown mycelium, such as MycoWorks’ Fine Mycelium™, shows the most promise of any leather alternative when measured on haptics (natural), carbon footprint (extremely low), and plastic use (near zero).
Availability of data and materials
For some further detail on the data and results, refer to the SI. The datasets generated and analyzed during the current study are not publicly available due to confidentiality but are available from the corresponding author on reasonable request.
Change history
29 May 2023
A Correction to this paper has been published: https://doi.org/10.1186/s12302-023-00741-4
Abbreviations
- EF:
-
Environmental footprint
- EVA:
-
Ethylene-vinyl acetate
- LCA:
-
Life cycle assessment
- LCIA:
-
Life cycle impact assessment
- SI:
-
Supporting information
- HVAC:
-
Heating, ventilation, air conditioning
- PEF:
-
Product environmental footprint
- PEFCR:
-
Product environmental footprint category rules
- PU:
-
Polyurethane
- PVC:
-
Polyvinyl chloride
- R&D:
-
Research and development
References
Arias P, Bellouin N, Coppola E, Jones R, Krinner G, Marotzke J et al (2021) Climate Change 2021: The Physical Science Basis. Contribution of Working Group14 I to the Sixth Assessment Report of the Intergovernmental Panel on Climate Change, Technical Summary
Aves AR, Revell LE, Gaw S, Ruffell H, Schuddeboom A, Wotherspoon NE, LaRue M, McDonald AJ (2022) First evidence of microplastics in Antarctic snow. Cryosphere 16(6):2127–2145
Bayer E, Mclntyre G, Swersey BL (2008) Method for producing grown materials and products made thereby. Rensselaer Polytechnic Institute and Ecovative Design Llc
Best Leather (2022) What is bicast leather? https://bestleather.org/types-of-leather/bicast/. Accessed 10 July 2022
Davis J (2020) Is vegan leather worse for the environment than real leather? https://www.harpersbazaar.com/uk/fashion/fashion-news/a30640996/vegan-leather-sustainability/
de Rosa-Giglio P, Fontanella A, Gonzalez-Quijano G, Ioannidis I, Nucci B, Brugnoli F (2018) Leather product environmental footprint category rules (Leather PEFCR). 25:1–160. https://ec.europa.eu/environment/eussd/smgp/pdf/PEFCR_leather.pdf
DESSERTO® (2022) DESSERTO®. https://desserto.com.mx/home. Accessed 10 July 2022
Dixit S, Yadav A, Dwivedi PD, Das M (2015) Toxic hazards of leather industry and technologies to combat threat: a review. J Clean Prod 87:39–49
Durlinger B, Koukouna E, Broekema R, Van Paassen M, Scholten J (2017) Agri-footprint 4.0—part 2 description of data. Gouda. The Netherlands
ecovative (2022) Leather. https://www.ecovative.com/pages/leather. Accessed 10 July 2022
EPA United States Environmental Protection Agency (2021) Plastics material—specific data. https://www.epa.gov/facts-and-figures-about-materials-waste-and-recycling/plastics-material-specific-data. Accessed 10 July 2022
Hildebrandt J, Thrän D, Bezama A (2021) The circularity of potential bio-textile production routes: comparing life cycle impacts of bio-based materials used within the manufacturing of selected leather substitutes. J Clean Prod. https://doi.org/10.1016/j.jclepro.2020.125470
Hutton M, Shafahi M (2019) Water pollution caused by leather industry: a review. Energy Sustain 59094:V001T10A002
Infinium (2021) Vegan leather market (Product—polyurethane, recycled polyester, and bio based; application—furnishing, automotive, footwear, bags, wallets, clothing, and other applications) global industry analysis trends, size, share and forecasts to 2026. https://www.infiniumglobalresearch.com/consumer-goods-packaging/global-vegan-leather-market
International Organization for Standardization (2006) Environmental management: life cycle assessment; Principles and Framework. ISO
Jones M, Gandia A, John S, Bismarck A (2021) Leather-like material biofabrication using fungi. Nature Sustain 4(1):9–16. https://doi.org/10.1038/s41893-020-00606-1
Joseph K, Nithya N (2009) Material flows in the life cycle of leather. J Clean Prod 17(7):676–682
Khwaja MA (2000) Environmental impacts of tanning and leather products manufacturing industry in NWFP. Pakistan
Kim D, Kim Y, Kim K, Shin H (2017) Research trend and product development potential of fungal mycelium-based composite materials. Korean Soc Biotech Bioeng J 32(3):174–178
Locker CR, Theregowda R (2022) Life-cycle assessment of Bioleather. Clean Circ Bioecon 1:100003
MacLeod M, Arp HPH, Tekman MB, Jahnke A (2021) The global threat from plastic pollution. Science 373(6550):61–65
Maga D, Galafton C, Blömer J, Thonemann N, Özdamar A, Bertling J (2022) Methodology to address potential impacts of plastic emissions in life cycle assessment. Int J Life Cycle Assess 27(3):469–491. https://doi.org/10.1007/s11367-022-02040-1
Material Innovation Initiative (2021) State of the Industry Report: Next-Gen Materials
Mogu (2022) Mogu demonstration at “Biofabricate” conference
Moreno Ruiz E, Valsasina L, FitzGerald D, Brunner F, Symeonidis A, Bourgault G, Wernet G (2019) Documentation of changes implemented in the. Ecoinvent database 6(5):1–97
Mycoworks (2020) A story of superior quality. https://www.madewithreishi.com/stories/performance-results-q120
Mycoworks (2022) Made with Reishitm. https://www.mycoworks.com/our-products#reishi-transforming-the-fashion-industry
Mycoworks (2022) Fine MyceliumTM. https://www.mycoworks.com/our-products#an-advanced–materials-platform. Accessed 20 July 2022
MyloTM (2022) Meet MyloTM. https://www.mylo-unleather.com/#meet-mylo. Accessed 20 July 2022
National Geographic (2022) A whopping 91 percent of plastic isn’t recycled. https://www.nationalgeographic.org/article/whopping-91-percent-plastic-isnt-recycled/. Accessed 20 July 2022
Natural Fiber Welding (2021) How MIRUM® is made. https://blog.naturalfiberwelding.com/how-mirum-is-made. Accessed 20 July 2022
Otake Y, Kobayashi T, Asabe H, Murakami N, Ono K (1995) Biodegradation of low-density polyethylene, polystyrene, polyvinyl chloride, and urea formaldehyde resin buried under soil for over 32 years. J Appl Polym Sci 56(13):1789–1796
Prabhu A, Davis-Peccoud J, van den Branden J-C, Mattios G (2020) Solving the consumer plastics puzzle. https://www.bain.com/insights/solving-the-consumer-plastics-puzzle/. Accessed 10 July 2022
Qua FJS (2019) (lm)Material : a qualitative study on sustainable materials for design through a comparative review of leather and its modern alternatives. lm 83. https://dspace.mit.edu/handle/1721.1/122335
Ruiz M (2013) Documentation of changes implemented in. Ecoinvent Rep 5:3
Science based targets (2022) Lead the way to a low—carbon future. https://sciencebasedtargets.org/how-it-works. Accessed 5 July 2022
Smith P (2020) Life cycle assessment and leather production. J Leather Sci Eng. https://doi.org/10.4324/9780080499314-24
The Editors of Encyclopaedia Britannica (2020) Leather. In: Encyclopaedia Britannica
The New York Times (2022) How fashion giants recast plastic as good for the planet. https://www.nytimes.com/2022/06/12/climate/vegan-leather-synthetics-fashion-industry.html. Accessed 20 July 2022
Thomas S, Rane AV, Kanny K, Abitha VK, Thomas MG (2018) Recycling of polyurethane foams. Elsevier, Amsterdam
UNEP (2018) Resolution ¾—united nations environment assembly of the united nations environment programme. United Nations Environment Programme, Nairobi
UNIDO (2010) Future trends in the world leather. United Nations Industrial Development Organization, Vienna
Bolt Threads Inc. v. Ecovative design LLC, (2019)
Vegea (2022) Fashion. https://www.vegeacompany.com/v-textile/. Accessed 10 July 2022
Weidema BP, Thrane M, Christensen P, Schmidt J, Løkke S (2008) Carbon footprint: a catalyst for life cycle assessment? J Indust Ecol 12(1):3–6. https://doi.org/10.1111/j.1530-9290.2008.00005.x
Zampori L, Pant R (2019) Suggestions for updating the Product environmental footprint (PEF) method. Publications Office of the European Union, Luxembourg. https://doi.org/10.2760/424613
Acknowledgements
The authors would like to acknowledge Cory Fulkerson for collecting and reporting facility and process energy data and Mike Lindheim for analysis and data collection of prospective scale-up scenarios. They thank Curtidos Badia for their cooperation in providing data on tannery post-processing.
Funding
This study was funded by MycoWorks Inc. The role of MycoWorks in this study was to provide primary data for the analysis, build realistic partially prospective scenarios for analysis, provide sector—and market-specific knowledge, co-author sections of the manuscript, and to review the draft manuscript.
Author information
Authors and Affiliations
Contributions
EW updated and adapted the Reishi™ LCA model with the latest data and scenarios, analyzed the data, produced the figures, and was the primary author of the manuscript. KC built the initial LCA models for Reishi™ and the benchmark bovine leather and reviewed the final Reishi™ LCA model. LG substantially revised the manuscript. BM led the coordination for MycoWorks, Inc., including data collection and identifying scenario analyses, and revised the manuscript. MS co-authored the abstract, introduction and conclusions, substantially revised the final manuscript, and re-touched the graphs. All the authors read and approved the final manuscript.
Corresponding author
Ethics declarations
Ethics approval and consent to participate
Not applicable.
Consent for publication
Not applicable.
Competing interests
The authors declare that they have no competing interests.
Additional information
Publisher's Note
Springer Nature remains neutral with regard to jurisdictional claims in published maps and institutional affiliations.
Supplementary Information
Additional file 1:
Table S1. Estimated CO2-eq. emissions from mycelium grown via the Ecovative process for Ecovative’s Forager™ “mushroom leather” and as an input for Bolt Threads’ Mylo™ material. Table S2. Overview of main proxies taken for raw materials. Table S3. Characterized LCIA results for 1m2 of ReishiTM produced in the four scenarios, and for 1m2 of the benchmark product (using mycelium only). Table S4. Comparison of all available published data for leather alternatives *calculated value as explained in Table 1 and above. Figure S1. Characterized midpoint LCIA results of 1m2 of Reishi in the four scenarios compared to 1m2 of benchmark bovine leather, where the highest score is scaled to 100%. Figure S2. Environmental footprint (normalized and weighted results using the EF method 3.0 (Zampori & Pant, 2019)) for 1 m2 of Reishi™ in the four scenarios compared to 1 m2 of the benchmark bovine leather.
Additional file 2.
A complete LCI file of the foreground system for each of the four scenarios modelled.
Rights and permissions
Open Access This article is licensed under a Creative Commons Attribution 4.0 International License, which permits use, sharing, adaptation, distribution and reproduction in any medium or format, as long as you give appropriate credit to the original author(s) and the source, provide a link to the Creative Commons licence, and indicate if changes were made. The images or other third party material in this article are included in the article's Creative Commons licence, unless indicated otherwise in a credit line to the material. If material is not included in the article's Creative Commons licence and your intended use is not permitted by statutory regulation or exceeds the permitted use, you will need to obtain permission directly from the copyright holder. To view a copy of this licence, visit http://creativecommons.org/licenses/by/4.0/.
About this article

Cite this article
Williams, E., Cenian, K., Golsteijn, L. et al. Life cycle assessment of MycoWorks’ Reishi™: the first low-carbon and biodegradable alternative leather. Environ Sci Eur 34, 120 (2022). https://doi.org/10.1186/s12302-022-00689-x
Received:
Accepted:
Published:
DOI: https://doi.org/10.1186/s12302-022-00689-x